Water Chemistry
Water Chemistry — the Akva module — works with sets of water analyses rather than with simulations. You give it a table of major-ion measurements and it tells you whether each analysis is self-consistent, what kind of water it is, and whether it is fit for irrigation. It draws the three diagrams hydrochemists expect: Piper, Schoeller and USSL.
It is a licensed module. Nothing here needs PHREEQC, though the two work together well: the last example on this page computes saturation indices for the same waters.
What you give it
An analysis table, imported as Data In and Out. The columns are found by name, not by position, so the order does not matter and extra columns are ignored. What it looks for:
a name for each sample, and optionally a sampling point, a date and a category;
one column per component, in mg/l — electrical conductivity in µS/cm.
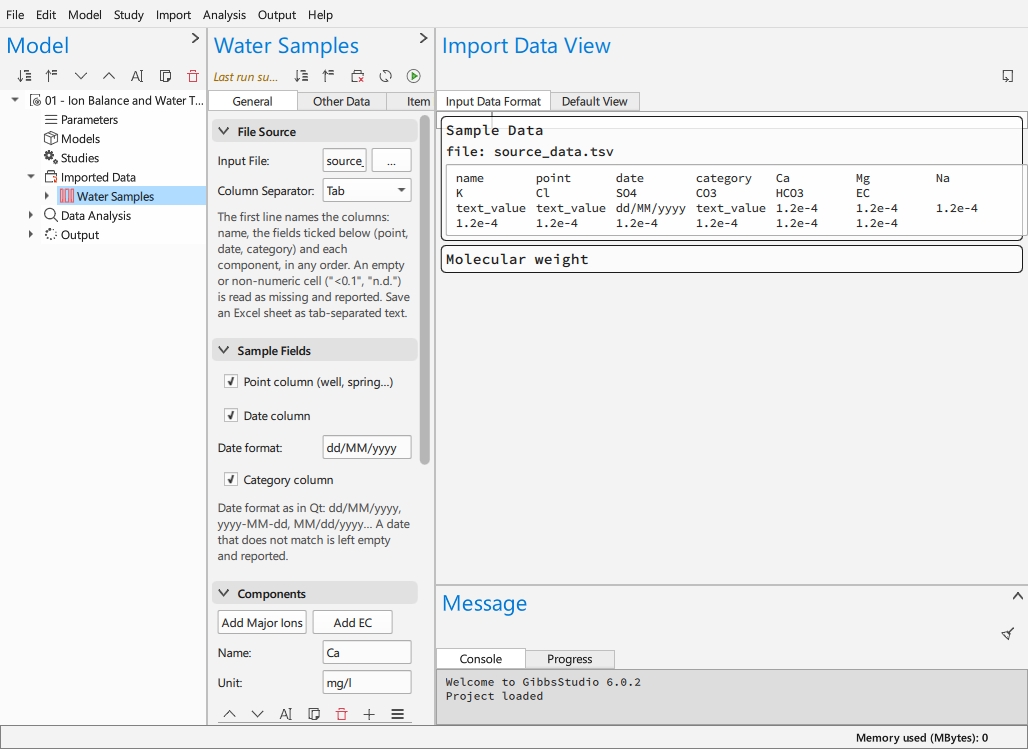
The eight major ions are what the analysis runs on: calcium, magnesium, sodium, potassium, bicarbonate, carbonate, chloride and sulphate. Everything is converted to meq/l internally, which is what makes the ions comparable.
Add Major Ions fills in those eight with their units in one step; Add EC
adds electrical conductivity. An empty or non-numeric cell — <0.1,
n.d. — is read as missing and reported rather than guessed at.
Because the columns are matched by name, the usual first job is making your laboratory’s header match. Open the imported table and check what was found before running an analysis on it.
The ion balance
The first question about any analysis is whether it can be trusted. A water is electrically neutral, so the cations and anions in meq/l must sum to the same number; they never do exactly, and the charge balance error says by how much:
The analysis reports the two sums, the CBE and whether it is within the tolerance you set — a few per cent is the usual expectation for a complete major-ion analysis. A sample outside it can be excluded, which leaves it in the table but keeps it out of the aggregates and the diagrams.
A large imbalance usually means something was not measured rather than something measured wrongly: an ion the water contains that the analysis has no column for. It is worth finding out which before using the sample.
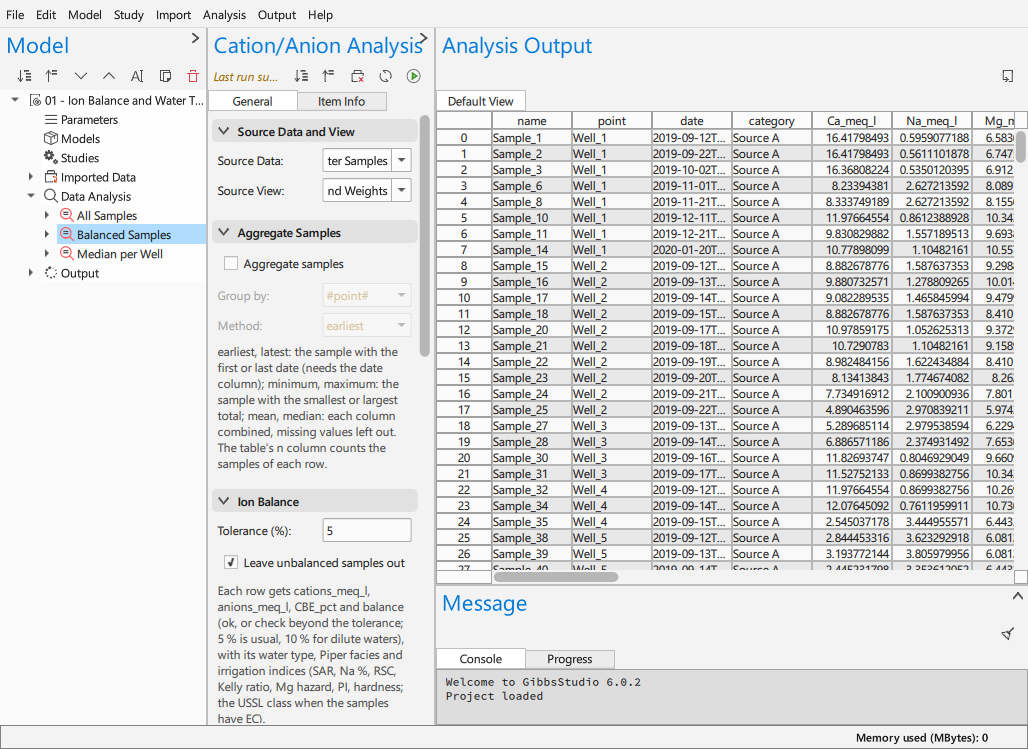
The analysis above is the one from 01 - Ion Balance and Water Types: its source table and view at the top, the aggregation settings below, and the ion balance tolerance with Leave unbalanced samples out at the bottom. The results appear beside it, a row per sample.
Water type and facies
From the same meq/l values the analysis names the water: its type by the dominant cation and anion, and its Piper facies. These are the labels hydrochemists use to say what a water is — calcium bicarbonate, sodium chloride — and they are what makes a set of analyses comparable at a glance.
Irrigation indices
For water meant for irrigation the analysis computes the standard indices:
- SAR, the sodium adsorption ratio
How much sodium the water carries relative to calcium and magnesium. High SAR degrades soil structure.
- Na %
Sodium as a percentage of the cations.
- RSC, residual sodium carbonate
Carbonate and bicarbonate in excess of calcium and magnesium.
- Kelly ratio, magnesium hazard, permeability index, hardness
The rest of the usual set.
- USSL class
With electrical conductivity, the combined salinity and sodium hazard class of Richards (1954) — the classification the USSL diagram shows.
Grouping samples
A set of analyses is rarely read one sample at a time. Samples can be aggregated by point or by category, which answers “what is this spring like” rather than “what was this bottle like”:
earliest and latest — the first or last sample of the group;
minimum and maximum — the whole sample that is extreme, not a per-column mixture;
mean and median.
Each aggregate reports how many samples it came from, which matters when reading it: a median of two is not a median.
The diagrams
- Piper
The classic trilinear diagram: cations on one triangle, anions on the other, both projected into the central diamond. Waters that plot together are of the same kind; a line of points often means mixing between two end members.
- Schoeller
A semi-logarithmic plot with one line per sample across the major ions, cations first. It keeps the actual concentrations, which Piper does not, so it shows strength as well as type.
- USSL (Wilcox)
Salinity against sodium hazard, with the classification fields drawn in. This is the irrigation-suitability diagram. The code and some literature call it Wilcox; it is Richards (1954).
Each is available as a quick result, which builds the plot and the analysis behind it in one step rather than making you assemble them.
Examples
01 – Ion Balance and Water Types — the starting point: import analyses, check their balance, classify them, draw Piper and Schoeller.
02 – Irrigation Suitability — the indices and the USSL diagram.
03 – Saturation Indices with PHREEQC — the same analyses handed to PHREEQC, so the measured waters can be asked what they are saturated with respect to.