08 - Surface Complexation
Zinc sorbing onto hydrous ferric oxide, as a function of pH, computed twice at concentrations a thousand-fold apart.
Running it twice is what makes the example. Sorption onto a surface with more than one kind of site behaves differently depending on how much metal there is to sorb, and the two figures show that directly.
Strong sites and weak sites
TITLE Example 8.--Sorption of zinc on hydrous iron oxides.
SURFACE_SPECIES
Hfo_sOH + H+ = Hfo_sOH2+
log_k 7.18
Hfo_sOH = Hfo_sO- + H+
log_k -8.82
Hfo_sOH + Zn+2 = Hfo_sOZn+ + H+
log_k 0.66
Hfo_wOH + H+ = Hfo_wOH2+
log_k 7.18
Hfo_wOH = Hfo_wO- + H+
log_k -8.82
Hfo_wOH + Zn+2 = Hfo_wOZn+ + H+
log_k -2.32
SOLUTION 1
-units mmol/kgw
pH 8.0
Zn @{$Zn_param$}@
Na 100. charge
N(5) 100.
SURFACE 1
Hfo_sOH 5e-6 600. 0.09
Hfo_wOH 2e-4
# -donnan
PHASES
Fix_H+
H+ = H+
log_k 0.0
#
EQUILIBRIUM_PHASES
Fix_H+ @{$-1*pH_param$}@ NaOH 10.0
The surface is the Dzombak and Morel hydrous ferric oxide model, which has two site types:
a small number of strong sites, which bind tightly;
many more weak sites, which bind less tightly.
That is not a fitting convenience. A real oxide surface has a range of binding environments – edges, defects, faces – and two site types is the smallest model that captures the consequence, which is that the average binding strength depends on how much of the surface is occupied.
The results
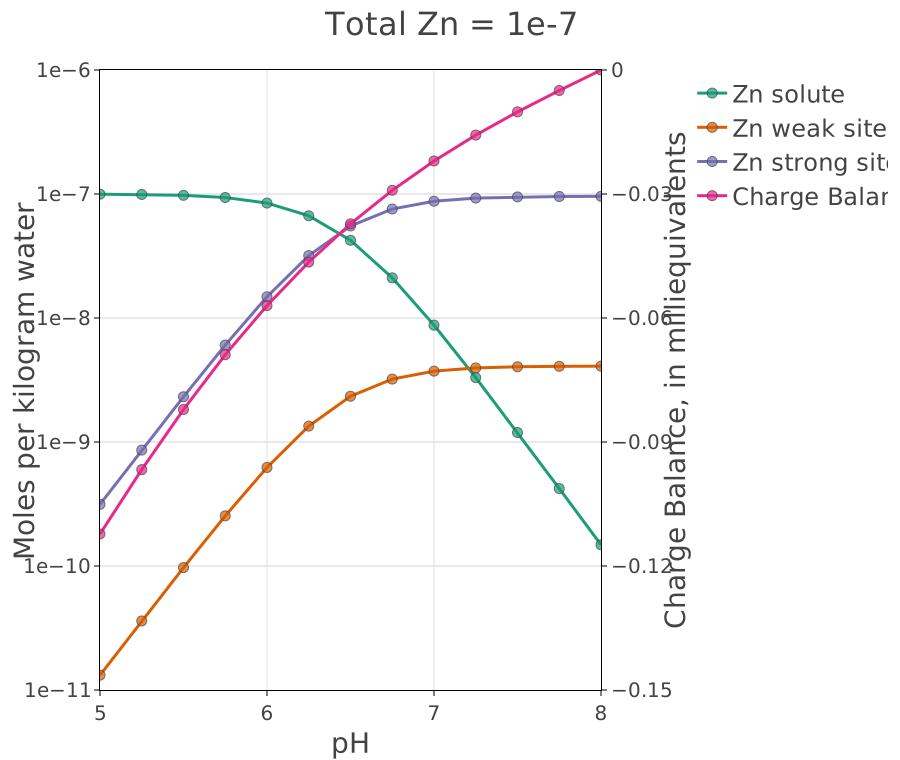
Total zinc 10⁻⁷ mol/kgw. There is far less zinc than there are strong sites, so essentially all of it goes to the strong sites and the weak sites are irrelevant. Sorption is strong and begins at low pH.
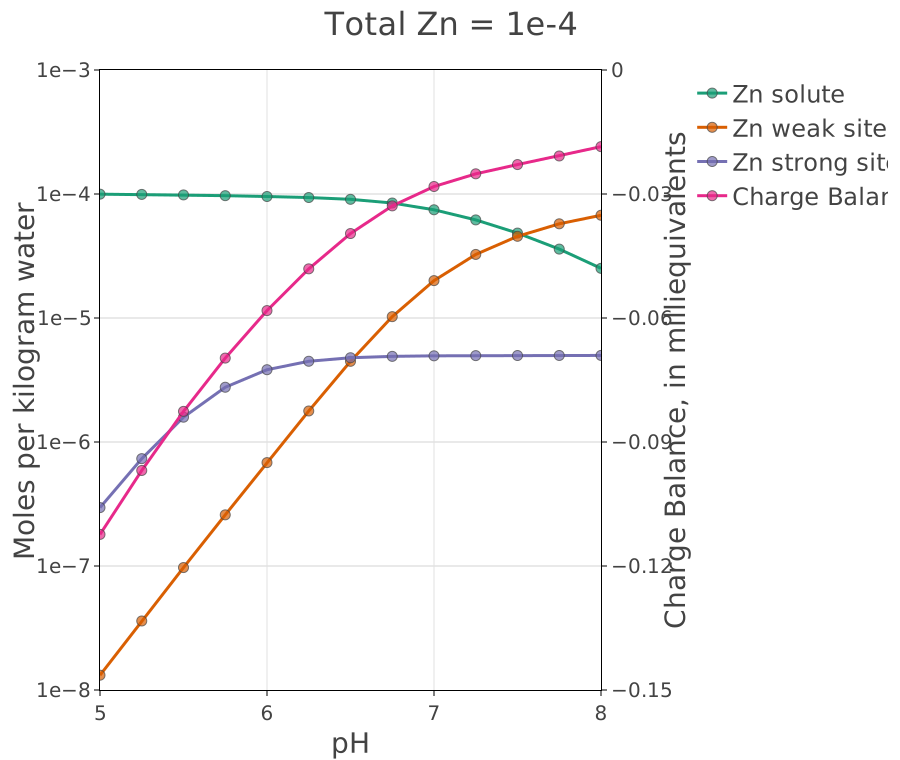
Total zinc 10⁻⁴ mol/kgw, a thousand times more. The strong sites fill and then stop – their curve flattens, because there are no more of them – and the remaining zinc goes to the weak sites. The edge moves to higher pH, because weaker sites need more favourable conditions to hold the metal.
This is why a distribution coefficient measured at one concentration cannot be used at another. The ratio of sorbed to dissolved is not a constant of the system; it depends on loading, and the dependence is not small.
The Charge Balance curve on both figures is the surface charge. It is
worth watching alongside the sorption: the surface becomes more negative as
pH rises, which is part of why the metal sorbs more at high pH, and the
sorbed metal in turn changes the charge.
What it shows
That surface complexation is chemistry, not a partition coefficient, and that it predicts the concentration dependence a coefficient has to be re-measured for.
19 - Modeling Cd+2 Sorption compares this kind of model directly with the empirical isotherms it replaces.
Source
Parkhurst, D. L. and Appelo, C. A. J. (2013). Description of input and examples for PHREEQC version 3. U.S. Geological Survey Techniques and Methods, book 6, chapter A43. This is Example 8 of that manual.
Dzombak, D. A. and Morel, F. M. M. (1990). Surface Complexation Modeling: Hydrous Ferric Oxide. Wiley, New York. The two-site model, its site densities and its constants are theirs.