01 - Database Comparison
A geochemical calculation is only as good as the thermodynamic database behind it, and the first question about any model is whether the database knows the chemistry you are about to ask it about. A database that is missing a species does not fail: it answers without it.
So: which of the six databases PHREEQC ships can model a water containing calcium, carbonate, sulfate, iron and uranium? A Database Comparison Study over the six answers it before a single simulation is run.
Asking about a system, not a database
The study is given the system rather than a list of things to look up: the elements, and the redox states that actually matter for them – Fe(2), Fe(3), U(4) and U(6). Redox states are listed separately because an element being present is not enough. A database that has uranium but only U(6) cannot tell you anything about a reducing environment, and the difference between the two states is the whole question in uranium chemistry.
It then produces three tables, which answer three different questions.
Summary – what is missing. phreeqc.dat has no uranium at all, and
pitzer.dat has neither uranium nor iron’s two redox states. llnl.dat,
minteq.v4.dat, sit.dat and wateq4f.dat have all of them. For the
water in question that rules two databases out immediately, which is the
cheapest decision in the project.
Coverage – how much of it each has. Being present is not being
well-described. Uranium species run from 44 in minteq.v4.dat to 125 in
sit.dat, and within U(6) from 22 to 87. Phases differ more: llnl.dat
has 209 uranium phases where wateq4f.dat has 30.
Neither extreme is automatically right. A large database may carry species whose constants are poorly known, and a small, curated one may be the better choice for a well-studied system. What the table gives you is the fact that the choice exists, with numbers attached.
Differences – where each individual species and phase is, and which databases lack it. This is the table to consult when two databases have given different answers and you need to know why. It is not plotted: it is a reference, read by searching.
The plots
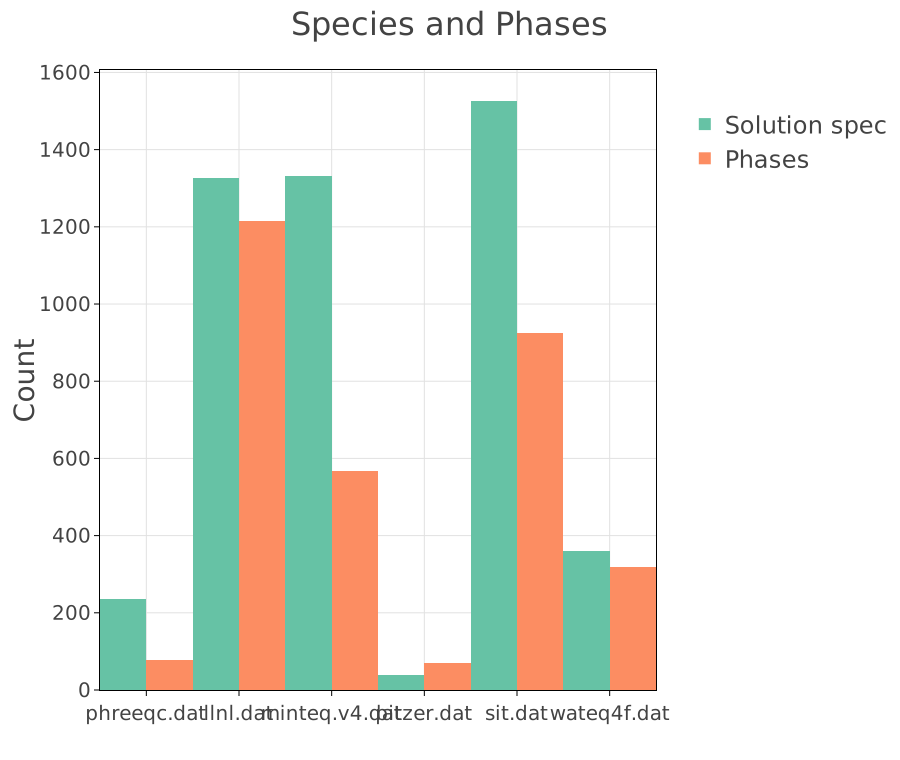
The size of each database: its solution species and its phases. This is the overall scale, before the system is taken into account – and the spread across the six is wide enough to explain why they do not agree.
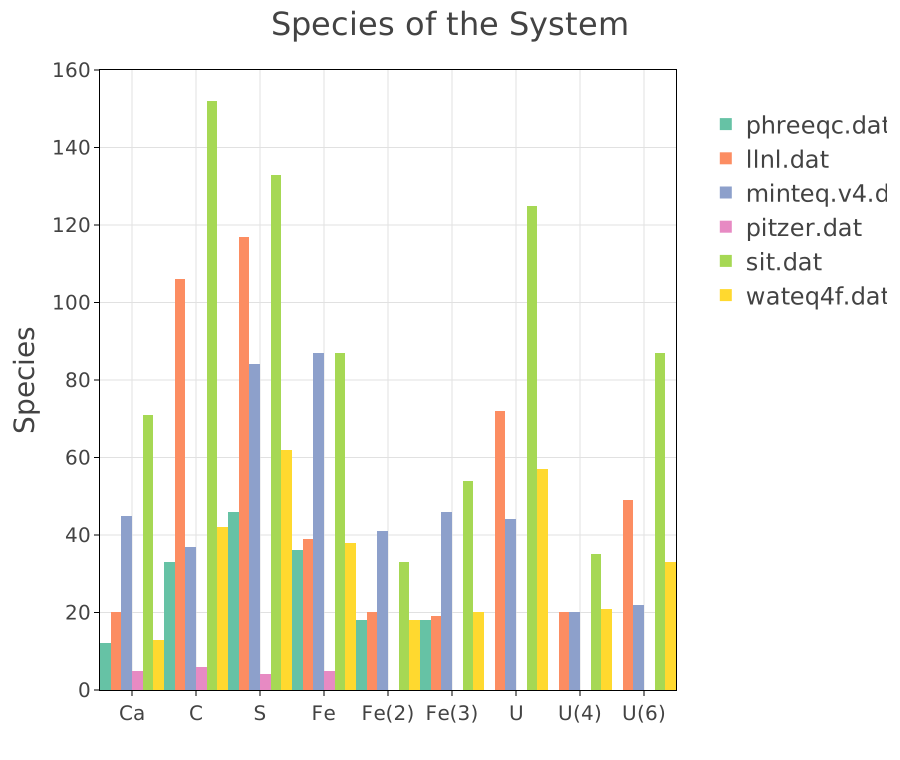
The same six databases, restricted to the system: how many species each has for each element and redox state asked for. The gaps are as informative as the bars. A missing bar is a database that cannot model that part of the chemistry at all, and a short one next to a tall one is where two databases will disagree.
What it concludes
For a calcium-carbonate-sulfate-iron-uranium water, phreeqc.dat and
pitzer.dat are out. Of the four that remain, the choice is between
coverage and curation, and the Coverage table is what the choice is made on.
03 - Calcite and Quartz in Four Databases goes one level deeper and compares not what the databases contain but what they say: the log K of the same mineral in four of them.
Source
Parkhurst, D. L. and Appelo, C. A. J. (2013). Description of input and examples for PHREEQC version 3. U.S. Geological Survey Techniques and Methods, book 6, chapter A43. The six databases compared here are those distributed with PHREEQC; each carries its own sources and compilation history in its header, which is worth reading before choosing one.