Data In and Out
Results are only useful if measurements can be brought in to compare them with, and if what you produce can be taken out to a report. This chapter covers both directions.
Importing a table
Imported Data holds data that did not come from a study — measurements to compare a simulation against, a table from a laboratory, observations to fit to.
Add an Imported Dataset and work through its form:
Choose the input file. Plain text in columns.
Choose the column separator: tab, semicolon, comma, space, minus or underscore.
Press Scan. GibbsStudio reads the file and reports the columns it found.
Tick the columns to import.
Press Import in the form dock’s toolbar.
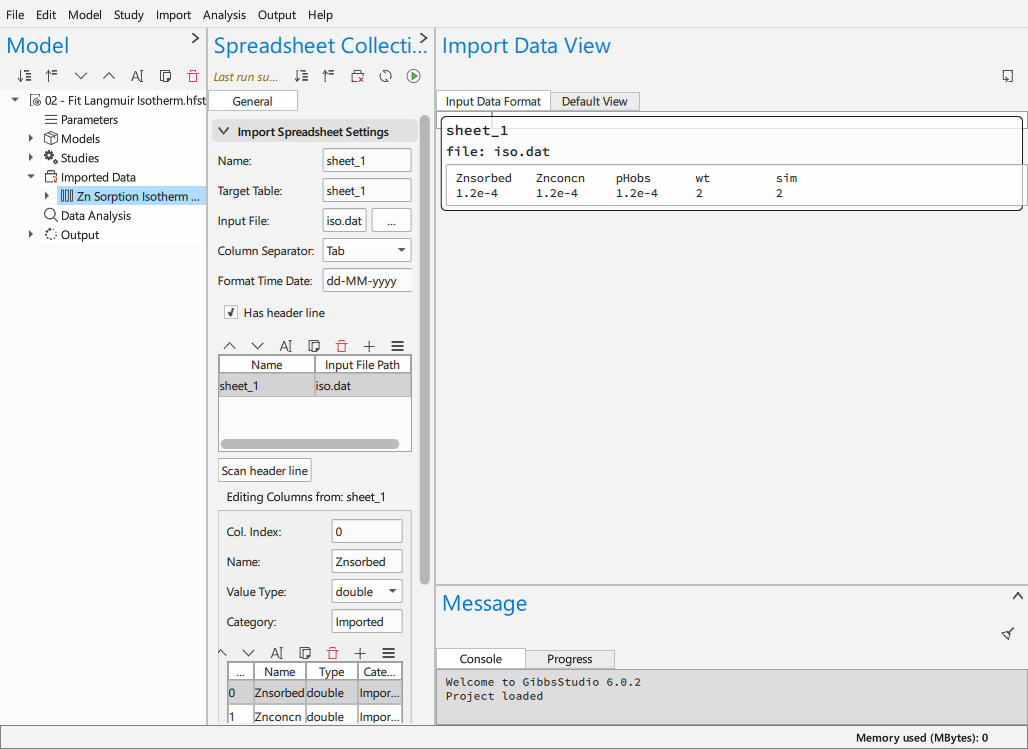
Scanning and importing are deliberately separate. Scanning tells you what the file looks like without committing; importing is what puts the data in the project.
Imported data is stored in the project, like everything else. The project does not keep a link to the file on disk, so moving or editing the file later changes nothing until you import again.
Once imported, a table is a data source like a study’s results: filters, tables, plots and analyses all read it. Water Chemistry and Parameter Fitting both start from one.
If a column does not appear, the usual causes are the wrong separator, a header spelled differently from what you expected, or a decimal comma where a decimal point was assumed.
Exporting results
The Output branch holds exports — entities that write results out as files. An export is an entity like any other: it is configured, computed, and recomputed when its source changes, so a report can be regenerated rather than reassembled by hand.
Two kinds:
- Table export
A results table written to a file. Comma- and tab-separated text for anything that reads columns, and
.xlsxfor a spreadsheet directly.- Image export
A plot written as an image.
Because exports live in the project, what you exported is recorded with the project that produced it.
Exporting one thing, once
Not everything needs an entity.
A plot can be saved as an image from its own toolbar — Save as image in the plot’s header.
A table selection can be copied with
Ctrl+Cand pasted into a spreadsheet or a document.
Use these for the figure you want now, and an export entity for the one you will want again after the next run.
Examples
03 – Time Series Analysis — two files of dated observations, turned into series a model can use.
03 – File as parameter input — an imported table driving a PHREEQC model, one simulation per row.
01 – Ion Balance and Water Types — 905 analyses imported as water samples, with their columns found by name.
A note on line endings
Exported text uses the line endings of the platform that wrote it: CRLF on Windows, LF on macOS and Linux. Tools read both; the difference shows up only when comparing two files byte for byte, or in a version-control system configured to care.