02 - Irrigation Suitability
Is this water fit for irrigation? The same 905 analyses as 01 - Ion Balance and Water Types, asked a question with an established answer: the US Salinity Laboratory’s classification, which judges a water on two hazards at once and names the result.
Nothing here is computed by a chemical model. Both hazards follow from the major-ion analysis, which is why this is an analysis of the samples rather than a simulation of them.
The two hazards
Salinity is read from the electrical conductivity, in four bands:
Class |
EC (µS/cm) |
Meaning |
|---|---|---|
C1 |
below 250 |
Low. Usable on most crops and soils. |
C2 |
250 to 750 |
Medium. Needs some leaching. |
C3 |
750 to 2250 |
High. Needs drainage and salt-tolerant crops. |
C4 |
above 2250 |
Very high. Not suitable under ordinary conditions. |
Sodium is read from the sodium adsorption ratio, in meq/l:
Sodium matters not because it harms the crop directly but because it displaces calcium and magnesium on the soil’s exchange sites, and a soil whose exchanger is dominated by sodium loses its structure and stops draining. The ratio is the right form for that: what counts is sodium relative to the divalent cations competing with it, not its concentration. Its four bands, S1 to S4, slope with EC, because a more saline water keeps its calcium in solution and does less damage at the same ratio.
A sample’s USSL class is the pair – C3-S1, C4-S1 – and the Cation/
Anion Analysis computes it along with the other irrigation indices: sodium
percentage, residual sodium carbonate, Kelly ratio, magnesium hazard,
permeability index and hardness. They are reported together because no single
one of them decides a case on its own.
Picking out the worst
A filter view on the analysis lists just the samples classed C4-S1, the
ones not suitable under ordinary conditions. It filters on the ussl_class
column the analysis computed, which is the useful consequence of the class
being a value in the results rather than only a position on a diagram: it can
be filtered, counted and joined like anything else.
The diagram
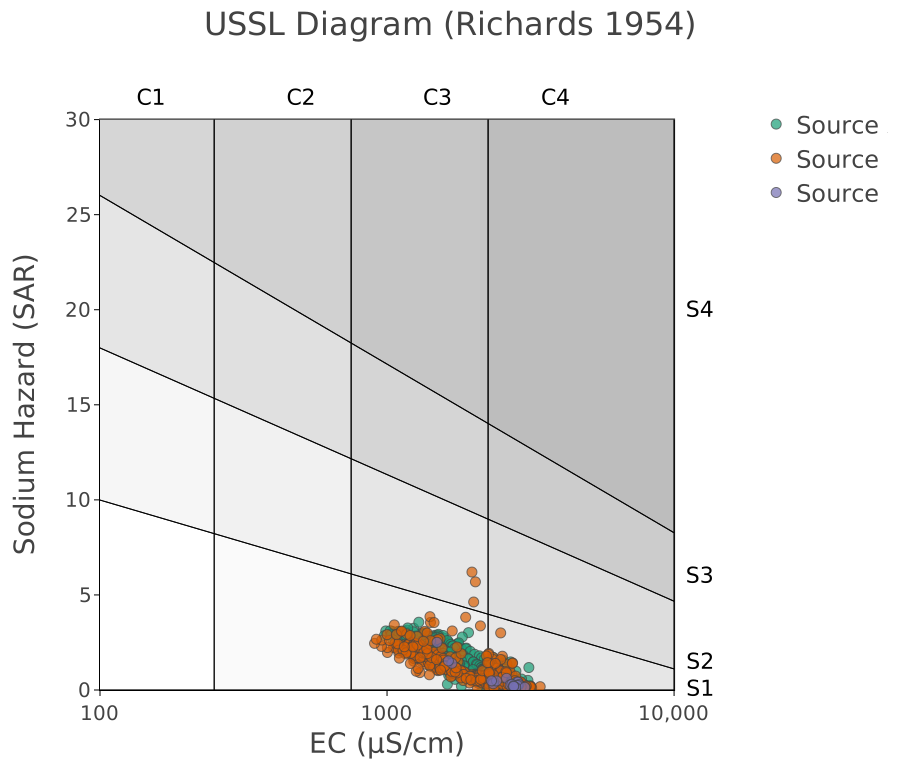
The USSL diagram, coloured by source. Every sample falls in the high (C3) or very high (C4) salinity band, and all but three in the low sodium band (S1) – the points form a flat cloud along the bottom of the diagram rather than spreading up it.
What it concludes
Salinity, not sodium, limits these waters. 593 samples are C3-S1, high salinity with low sodium: usable with moderate leaching and salt-tolerant crops. 309 are C4-S1, too saline for ordinary use. Only 3 reach S2. Source C is the most saline of the three, with 15 of its 18 samples in C4.
The practical reading is that these waters would be managed for salt – drainage, leaching fraction, crop choice – and that the sodium indices, while computed, are not what decides anything here.
Source
Richards, L. A., ed. (1954). Diagnosis and improvement of saline and alkali soils. Agriculture Handbook No. 60, United States Department of Agriculture, Washington D.C. The salinity and sodium bands, and the diagram itself, are taken from this handbook.
Wilcox, L. V. (1955). Classification and use of irrigation waters. Circular No. 969, United States Department of Agriculture, Washington D.C.
The data set is synthetic.