Cu-S-C Predominance
Copper in a water that also contains sulfate, carbonate and chloride – example 2 of the PhreePlot manual. Where As-O2-H2O Predominance had one element to speciate, this system has several ligands competing for the same metal, and the diagram is correspondingly less tidy.
It also makes a point that predominance diagrams make badly on their own, and so comes with two slices through it.
The system
PHASES
Fix_H+
H+ = H+
log_k 0.0
SOLUTION 1
Temp 20
pH 1.8 # set just below lowest pH
units mol/kgw
Cu 1e-1 # total concns
S(6) 1e-1
Na 1e-1 # background electrolyte
Cl 1.032e-1
END
USE solution 1 # loop on last simulation by default
EQUILIBRIUM_PHASES 1
Fix_H+ @{$-1*ph_param$}@ NaOH
-force_equality true
O2(g) @{$o2_pressure$}@ 0.1
CO2(g) -3.5 1.0 # N.B. no minerals
END
0.1 mol/l each of copper and sulfate, in a 0.1 mol/l NaCl background at 20 °C, with CO2 fixed at a log fugacity of -3.5 – roughly atmospheric. The starting pH of 1.8 is set just below the bottom of the grid, so that fixing pH always means adding base rather than acid.
Fix_H+ and O2(g) impose the two axes as before: pH 2 to 10, log fO2
from -80 to 0. The input carries a pointed comment, N.B. no minerals:
only aqueous species compete here. A copper system this concentrated would
precipitate in reality, and leaving the solids out is a decision about what
the diagram is asking, not an oversight.
The diagram
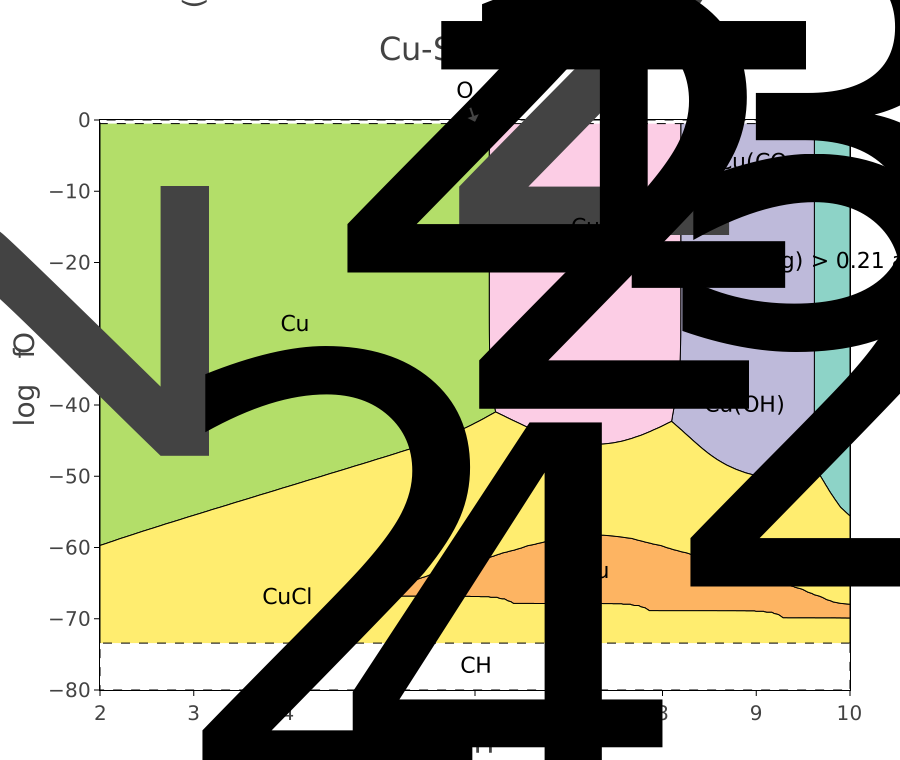
Six copper species hold territory. Cu+2 occupies the oxidised, acid corner; Cu2(OH)2+2 and Cu(OH)2 follow as pH rises and the metal hydrolyses; Cu(CO3)2-2 takes the alkaline side, where carbonate out- competes hydroxide. Below the redox boundary copper is Cu(I), as Cu+ and as the chloride complex CuCl2-.
That CuCl2- appears at all is the thing to notice. Chloride is here only as a background electrolyte, and it still wins a region of the diagram: Cu(I) binds chloride strongly enough that what was meant to be inert ionic strength becomes part of the chemistry.
As before, the strips marked O2(g) > 0.21 atm and CH4(g) > 1 atm
are outside what can occur.
What the diagram cannot show
A predominance diagram shows the winner and nothing else. It gives no sense of by how much, and no sense of what the other species are doing – and in a system with this many complexes, the dominant one may hold only a modest share.
The two slices cut through the diagram at log fO2 = -63, in the reducing part, and plot concentrations directly.
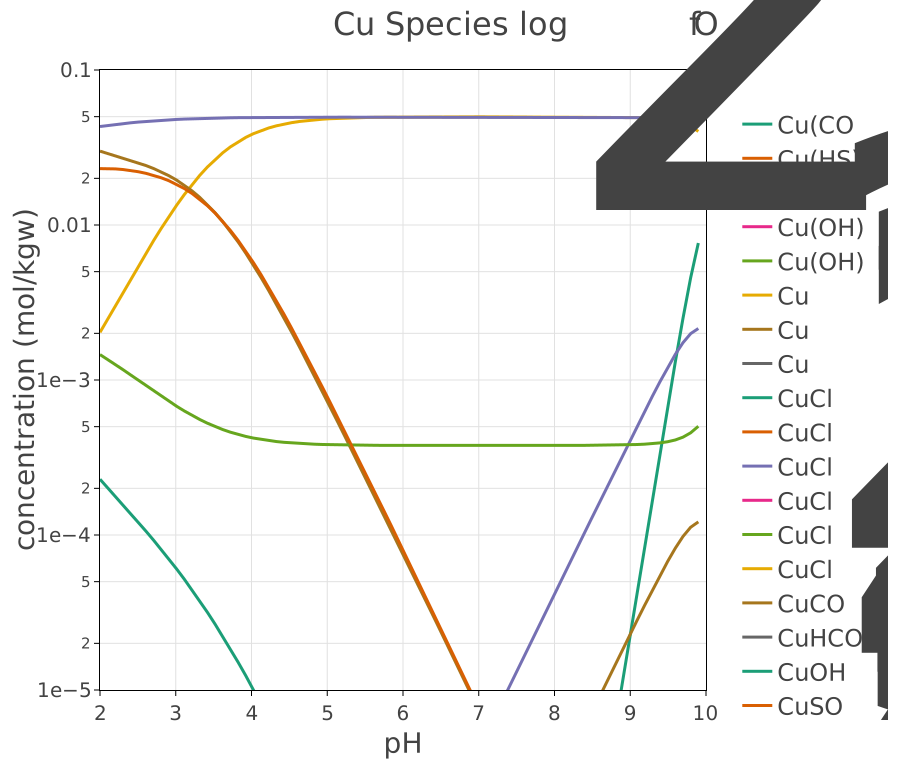
Every copper species along that line: eighteen of them, against pH. The predominance diagram showed two regions here. This shows the handover between them as what it is – curves crossing, with several species within an order of magnitude of each other through the transition, and a whole population of minor complexes that never appear on the diagram at all.
Read the two together. The diagram says where; the slice says how much, and whether “dominant” meant 90 % or 35 %.
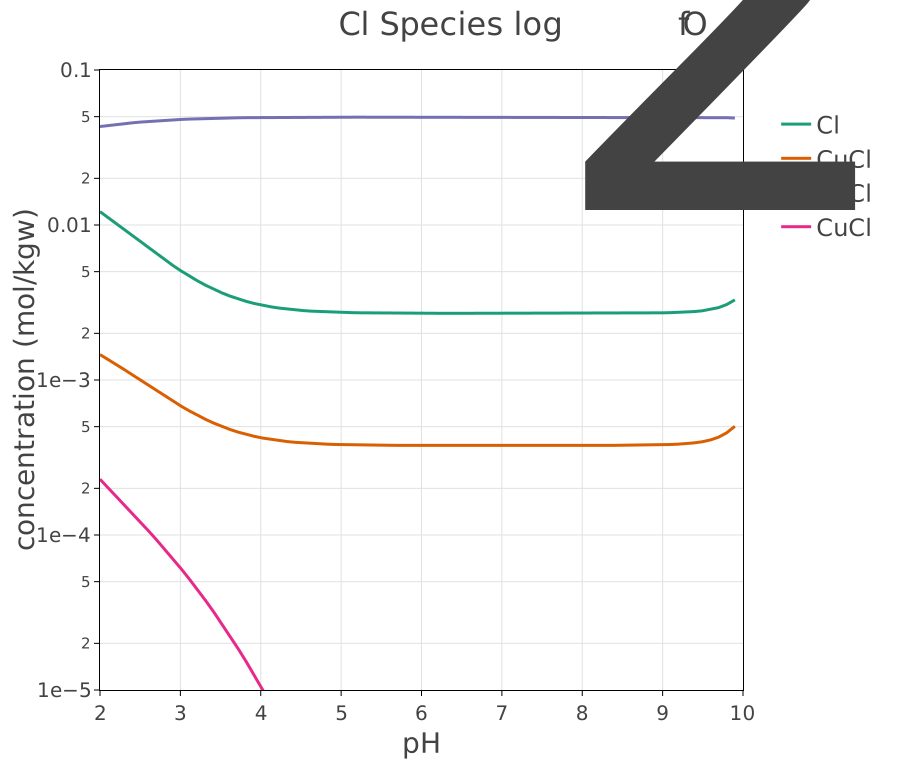
The chloride species on the same line. Free Cl- dominates throughout, as it must at this ionic strength, and below it CuCl+, CuCl2- and CuCl3-2 trade places as pH changes.
This is the quantitative version of the previous point: the copper- chloride complexes are a small fraction of the chloride but a large fraction of the copper. Which of those two statements you make depends entirely on what you divide by, and a diagram drawn per element cannot make both.
Try it
Move the slice to an oxidising fugacity and compare which species are in play.
Drop the chloride to 1 mmol/l and watch the CuCl2- region shrink or vanish.
Let a copper mineral into the equilibrium phases and see how much of the diagram survives.
Source
Kinniburgh, D. G. and Cooper, D. M. (2011). PhreePlot: Creating graphical output with PHREEQC. This is example 2 of the PhreePlot manual. See the PhreePlot website.
The thermodynamic data is
wateq4f.dat, distributed with PHREEQC (Parkhurst and Appelo, 2013).