Fe-As Predominance
Three diagrams of the same elements, differing only in what the arsenic is allowed to do. They are examples 10, 11 and 12 of the PhreePlot manual, and the reason to show them on one page is that the difference between them is the answer to a practical question: what controls arsenic in an iron-bearing water?
The axes here are pH against pe rather than oxygen fugacity. The two say the same thing about redox; pe is the more familiar of the pair to most readers, and it is what the original uses for these examples.
Ex 10 – the full system
PHASES
Fix_H+
H+ = H+
log_k 0.0
SOLUTION 1
temp 25
pH 1.8
units mol/kgw
S(6) 5e-3
Fe 5e-3
As 1e-2
Na 1e-1
Cl 1e-1 charge
END
USE solution 1
EQUILIBRIUM_PHASES 1
Fix_H+ @{$-1*ph_param$}@ NaOH 10
-force_equality true
O2(g) @{$o2_pressure$}@ 0.1
CO2(g) -3.5 10
Realgar 0 0
Orpiment 0 0
As2S3(am) 0 0
Halite 0 0
Arsenolite 0 0
Claudetite 0 0
Pyrite 0 0
Mackinawite 0 0
FeS(ppt) 0 0
Sulfur 0 0
Fe(OH)2.7Cl.3 0 0
# Goethite 0 0
Fe(OH)3(a) 0 0
# Hematite 0 0
Greigite 0 0
Magnetite 0 0
Nahcolite 0 0
Siderite 0 0
Maghemite 0 0
Siderite(d)(3) 0 0
Scorodite 0 0
Natron 0 0
Thermonatrite 0 0
Fe3(OH)8 0 0
Thenardite 0 0
Melanterite 0 0
Mirabilite 0 0
As2O5(cr) 0 0
Trona 0 0
Jarosite-Na 0 0
JarositeH 0 0
END
Iron, arsenic, sulfate and carbonate, with a long list of minerals permitted to form: realgar, orpiment, pyrite, mackinawite, siderite, scorodite, magnetite, the jarosites and some twenty more. Nothing sorbs.
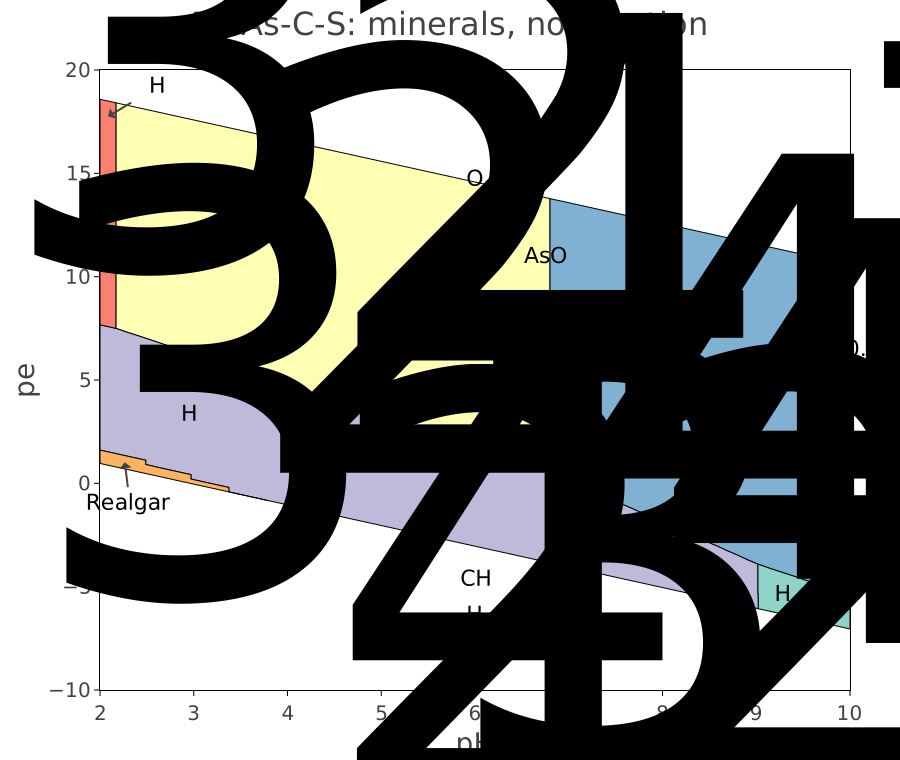
Arsenic is aqueous over most of the plane – H3AsO4, H2AsO4-, HAsO4-2 as As(V) above, H3AsO3 and H2AsO3- as As(III) below – except in the reducing, acid corner, where realgar (AsS) takes over. Sulfide is the one thing in this system that removes arsenic from solution, and it does so only where there is sulfide to be had.
Note what is not here: no iron mineral dominates any region of the arsenic diagram. Iron is precipitating across much of this plane, but a diagram of arsenic speciation does not show that unless the iron takes arsenic with it.
Ex 11 – iron and arsenic alone
PHASES
Fix_H+
H+ = H+
log_k 0.0
SOLUTION 1
pH 1.8 # start at a low pH (less than xmin)
units mol/kgw
Fe(3) 1e-1
Na 1e-1
Cl 1e-1
As 1e-2 # total As
END
# second simulation
USE solution 1
EQUILIBRIUM_PHASES 1
Fix_H+ @{$-1*ph_param$}@ NaOH 10
-force_equality true
O2(g) @{$o2_pressure$}@ 0.1
Fe(OH)3(a) 0 0 # but no adsorbed As
Arsenolite 0 0 # possible As minerals
Claudetite 0 0
Scorodite 0 0
As2O5(cr) 0 0
END
Sulfur and carbon removed. Ferric iron at 0.1 mol/l, arsenic at 10 mmol/l, with ferrihydrite and the arsenic minerals allowed – but, as the input says in as many words, no adsorbed As.
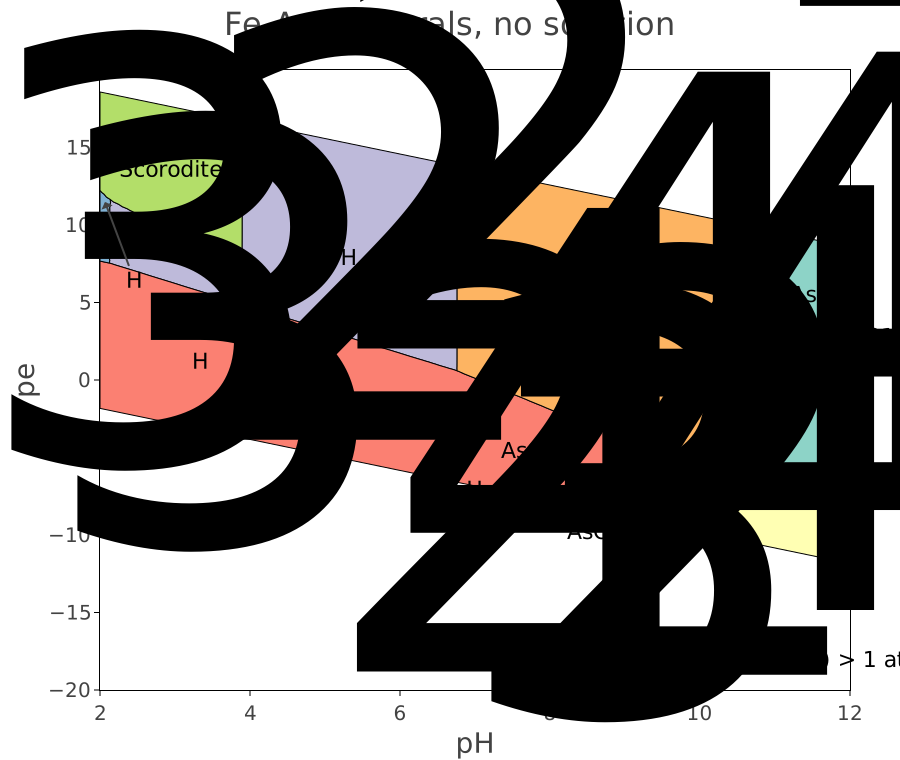
With the sulfide gone, realgar goes with it, and the arsenic is aqueous almost everywhere. Scorodite (FeAsO4·2H2O) claims the oxidised, acid corner – precipitation is now the only way iron can take arsenic out of solution, and it needs enough acid to keep the iron available.
Over the rest of the plane this is a diagram of acid-base chemistry: the As(V) series across the top, the As(III) series below, and the redox boundary between them.
Ex 12 – the same, with sorption
PHASES
Fix_H+
H+ = H+
log_k 0.0
SOLUTION 1
pH 1.8 # start at a low pH (less than xmin)
units mol/kgw
Fe(3) 1e-1
Na 1e-1
Cl 1e-1
As 1e-2 # total As
END
# second simulation
USE solution 1
# standard Hfo block (consistent with Dzombak and Morel's HFO)
SURFACE 1
    Hfo_sOH Fe(OH)3(a)      equilibrium_phase 0.005  53300
    Hfo_wOH Fe(OH)3(a)      equilibrium_phase 0.2
EQUILIBRIUM_PHASES 1
Fix_H+ @{$-1*ph_param$}@ NaOH 10
-force_equality true
O2(g) @{$o2_pressure$}@ 0.1
Fe(OH)3(a) 0 0 # but no adsorbed As
Arsenolite 0 0 # possible As minerals
Claudetite 0 0
Scorodite 0 0
As2O5(cr) 0 0
END
Identical to ex 11 but for one block:
SURFACE 1
Hfo_sOH Fe(OH)3(a) equilibrium_phase 0.005 53300
Hfo_wOH Fe(OH)3(a) equilibrium_phase 0.2
The ferrihydrite that ex 11 merely precipitated is now given a surface, with
strong and weak sites, in the standard Dzombak and Morel parameterisation.
equilibrium_phase ties the amount of surface to the amount of the mineral
present, so the sorption capacity appears and disappears with the
ferrihydrite instead of being a fixed quantity.
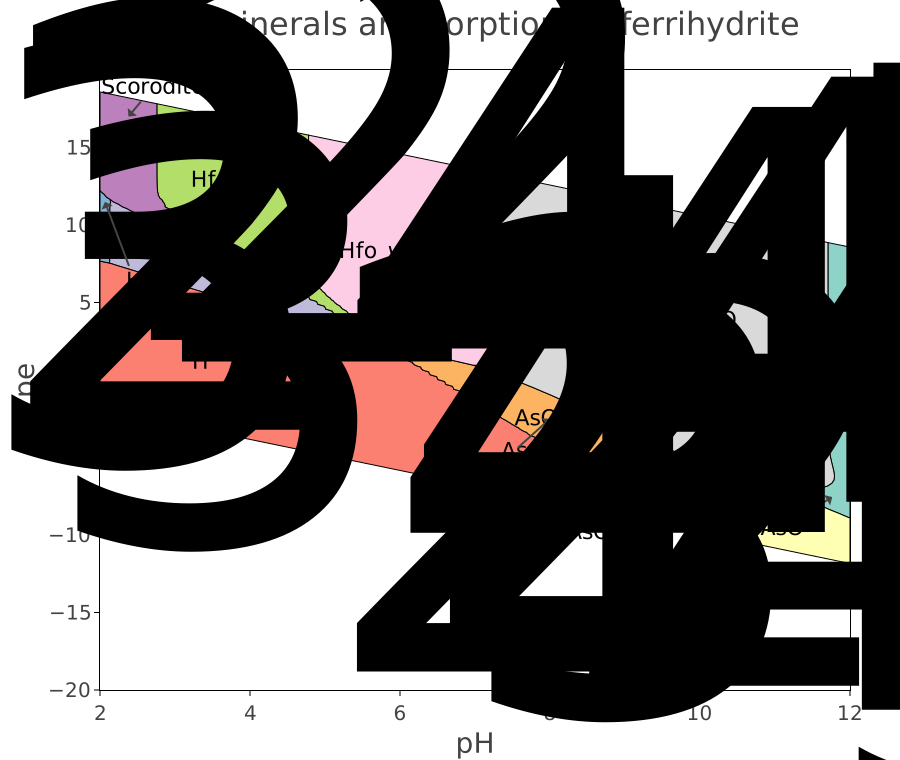
Four surface species – Hfo_wH2AsO3, Hfo_wH2AsO4, Hfo_wHAsO4- and Hfo_wOHAsO4-3 – now hold a large part of the diagram, and they take it from the dissolved As(V) species of ex 11. HAsO4-2, which had a region of its own there, no longer dominates anywhere.
What the three say together
Arsenic is controlled by three different mechanisms in three different parts of the plane, and which one you see depends on what the model was allowed to consider:
where sulfide is present, by precipitation as realgar (ex 10);
in acid oxidising conditions, by precipitation as scorodite (ex 11);
elsewhere, wherever ferrihydrite exists, by sorption (ex 12).
The last is the one that matters most in natural waters, and it is the one the first two diagrams miss entirely. A model that allows every mineral but no surface will conclude that arsenic stays in solution across most of the plane. It will be wrong, and it will not look wrong.
This is the general lesson, and it is not about arsenic. A predominance diagram shows the winner among the processes it was given. Leaving one out does not produce a gap – it redistributes the territory among the rest.
Try it
Take the
SURFACEblock out of ex 12 and confirm you get ex 11 back.Reduce the ferrihydrite’s site density and watch the sorbed regions retreat.
Put sulfur back into ex 12 and see whether realgar or the surface wins the reducing corner.
Source
Kinniburgh, D. G. and Cooper, D. M. (2011). PhreePlot: Creating graphical output with PHREEQC. These are examples 10, 11 and 12 of the PhreePlot manual. See the PhreePlot website.
Dzombak, D. A. and Morel, F. M. M. (1990). Surface Complexation Modeling: Hydrous Ferric Oxide. Wiley, New York. The Hfo site types, densities and surface area used in ex 12 are theirs.
The thermodynamic data is
wateq4f.dat, distributed with PHREEQC (Parkhurst and Appelo, 2013).